Differences between revisions 3 and 4
| Deletions are marked like this. | Additions are marked like this. |
| Line 44: | Line 44: |
|
=== Multiple plots at once === If you have multiple plots you can write a loop Gel data {{{ size Gel1 Gel2 Gel3 Gel4 Gel5 Gel6 Gel7 Gel8 Gel9 100 2.9 2.85 2.85 3 3 2.6 4.85 5.2 6.4 90 3.1 3 3 3.15 3.25 2.8 5.15 5.55 6.8 80 3.3 3.25 3.25 3.4 3.45 3 5.6 5.95 7.35 70 3.55 3.5 3.5 3.7 3.75 3.25 6.05 6.5 8 60 3.9 3.85 3.9 4.05 4.1 3.6 6.7 7.15 8.85 50 4.3 4.25 4.25 4.45 4.5 4 7.95 8 9.9 40 4.9 4.85 4.85 5.05 5.15 4.5 8.45 9.1 11.3 30 5.7 5.7 5.55 5.9 5.95 5.3 NA NA NA 20 6.95 6.9 6.85 7 7.2 6.4 NA NA NA }}} Unknowns {{{ Band unk1 unk2 unk3 unk4 unk5 unk6 unk7 unk8 unk9 upper 6.05 5.9 6.25 3.6 3.9 3.3 5.05 5.6 7 lower 7.05 6.9 7.3 5.15 5.25 4.5 6.1 6.6 8.4 }}} attachment:multiple_plots.jpg {{{ # read in a files of standards stds <- read.table(file="stds.txt", sep="\t", header=T) unks <- read.table(file="unks.txt", sep="\t", header=T) y <- stds[,"size"] # png(filename="mobility_plots.png", width=500, height=500) pdf(file="mobility_plots.pdf") # par(mfrow=c(3,3)) for(i in 2:ncol(stds)){ mdata <- data.frame(x=stds[,i], y=log10(y)) my.fit <- lm(y ~ x, data=mdata) unk <- data.frame(x=unks[,i]) unk1 <- predict.lm(my.fit, unk, se.fit=T)$fit[1] unk2 <- predict.lm(my.fit, unk, se.fit=T)$fit[2] size1 <- sprintf("%.1f", 10^unk1) size2 <- sprintf("%.1f", 10^unk2) # cat(size1, " ", size2, "\n") plot(mdata[,"x"], log10(y), pch=19, main=paste(colnames(stds)[i], " size vs. mob."), xlab="cm", ylab="size (bp)", yaxt="n") abline(my.fit, col="grey") axis(2, at = log10(y), labels = y) segments(0, unk1, unk[1,], unk1, lty="dashed", col="grey") segments(0, unk2, unk[2,], unk2, lty="dashed", col="grey") segments(unk[1,], min(log10(y)), unk[1,], unk1, lty="dashed", col="grey") segments(unk[2,], min(log10(y)), unk[2,], unk2, lty="dashed", col="grey") labxmarg <- max(stds[,i],na.rm=T) - 1 text(labxmarg, 1.95, paste("u =",size1), col="grey30") text(labxmarg, 1.84, paste("l =",size2), col="grey30") } dev.off() }}} |
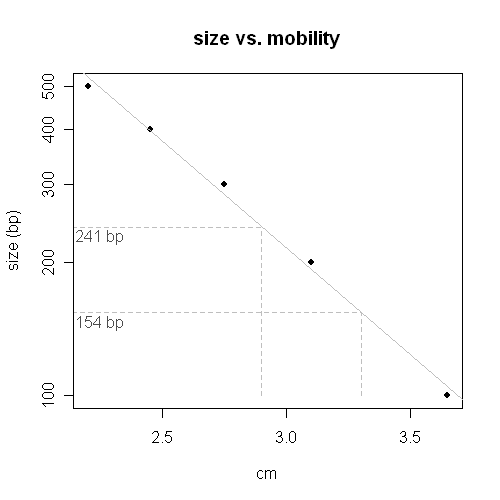
How to use R to determine unknowns on an XY plot

x <- c(2.2,2.45,2.75,3.1,3.65)
y <- c(500,400,300,200,100)


mdata <- data.frame(x=x, y=log10(y))
my.fit <- lm(y ~ x, data=mdata)


unk <- data.frame(x=c(2.9, 3.3))
predict.lm(my.fit, unk, se.fit=T)

png(filename="mobility_plot.png", width=500, height=500)
plot(x, log10(y), pch=19, main="size vs. mobility", xlab="cm", ylab="size (bp)", yaxt="n")
abline(my.fit, col="grey")
# 2.381945 2.188279
segments(0, 2.38, 2.9, 2.38, lty="dashed", col="grey")
segments(0, 2.188, 3.3, 2.188, lty="dashed", col="grey")

segments(2.9, min(log10(y)), 2.9, 2.38, lty="dashed", col="grey")
segments(3.3, min(log10(y)), 3.3, 2.188, lty="dashed", col="grey")


axis(2, at = log10(y), labels = y)
text(2.25, 2.36, "241 bp", col="grey30")
text(2.25, 2.165, "154 bp", col="grey30")

dev.off()
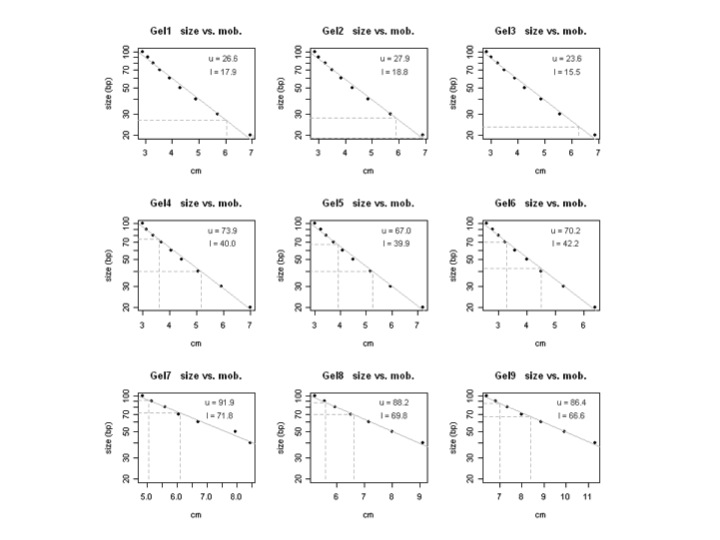
Multiple plots at once
If you have multiple plots you can write a loop
Gel data
size    Gel1    Gel2    Gel3    Gel4    Gel5    Gel6    Gel7    Gel8    Gel9
100     2.9     2.85    2.85    3       3       2.6     4.85    5.2     6.4
90      3.1     3       3       3.15    3.25    2.8     5.15    5.55    6.8
80      3.3     3.25    3.25    3.4     3.45    3       5.6     5.95    7.35
70      3.55    3.5     3.5     3.7     3.75    3.25    6.05    6.5     8
60      3.9     3.85    3.9     4.05    4.1     3.6     6.7     7.15    8.85
50      4.3     4.25    4.25    4.45    4.5     4       7.95    8       9.9
40      4.9     4.85    4.85    5.05    5.15    4.5     8.45    9.1     11.3
30      5.7     5.7     5.55    5.9     5.95    5.3     NA      NA      NA
20      6.95    6.9     6.85    7       7.2     6.4     NA      NA      NA
Unknowns
Band    unk1    unk2    unk3    unk4    unk5    unk6    unk7    unk8    unk9
upper   6.05    5.9     6.25    3.6     3.9     3.3     5.05    5.6     7
lower   7.05    6.9     7.3     5.15    5.25    4.5     6.1     6.6     8.4

# read in a files of standards
stds <- read.table(file="stds.txt", sep="\t", header=T)
unks <- read.table(file="unks.txt", sep="\t", header=T)

y <- stds[,"size"]

# png(filename="mobility_plots.png", width=500, height=500)
pdf(file="mobility_plots.pdf")
# par(mfrow=c(3,3))
for(i in 2:ncol(stds)){

  mdata <- data.frame(x=stds[,i], y=log10(y))
  my.fit <- lm(y ~ x, data=mdata)

  unk <- data.frame(x=unks[,i])
  unk1 <- predict.lm(my.fit, unk, se.fit=T)$fit[1]
  unk2 <- predict.lm(my.fit, unk, se.fit=T)$fit[2]
  size1 <- sprintf("%.1f", 10^unk1)
  size2 <- sprintf("%.1f", 10^unk2)
  # cat(size1, " ", size2, "\n")

  plot(mdata[,"x"], log10(y), pch=19, main=paste(colnames(stds)[i], "  size vs. mob."), xlab="cm", ylab="size (bp)", yaxt="n")
  abline(my.fit, col="grey")
  axis(2, at = log10(y), labels = y)

  segments(0, unk1, unk[1,], unk1, lty="dashed", col="grey")
  segments(0, unk2, unk[2,], unk2, lty="dashed", col="grey")

  segments(unk[1,], min(log10(y)), unk[1,], unk1, lty="dashed", col="grey")
  segments(unk[2,], min(log10(y)), unk[2,], unk2, lty="dashed", col="grey")

  labxmarg <- max(stds[,i],na.rm=T) - 1

  text(labxmarg, 1.95, paste("u =",size1), col="grey30")
  text(labxmarg, 1.84, paste("l =",size2), col="grey30")
}
dev.off()
