Describe R/Notes here.
data smoothing
loess(), runmed()
track <- import("foo.wig")

scores <- score(track)

chr1 <- track["chr1"] # limit to single chromosome

y <- rep(score(chr1), width(chr1))

x <- as.integer(unlist(ranges(chr1)))

lo <- loess(y ~ x)
Poisson Probability Example
The ppois() function from R can be used for estimating a probability.
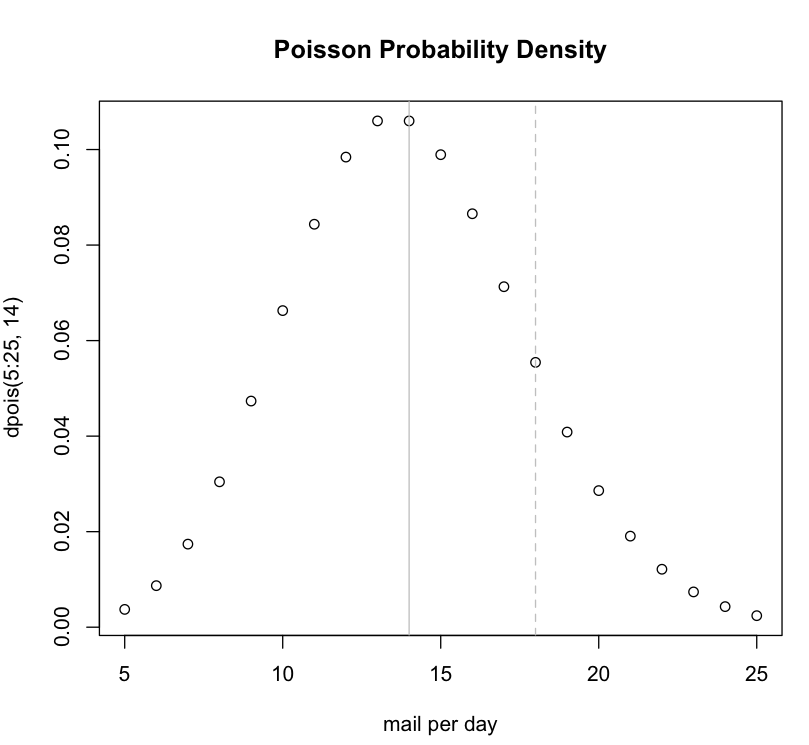
Imagine the postal carrier brings you 14 pieces of mail on average every single day. What's the likelihood of getting 18 or more pieces of mail on a given day?
We could plot a curve using the dpois() function to examine a range of values:
plot(5:25,dpois(5:25,14), main="Poisson Probability Density", xlab="mail per day")
abline(v=18, col="grey", lty="dashed")
abline(v=14, col="grey")

By default, the ppois() function has lower.tail = TRUE. This means when you ask a question about a specific number from the poisson distribution curve, the function returns the surface area present to the left of the number. To get the surface area to the right of your number, set lower.tail = FALSE.
> ppois(18,lambda=14, lower.tail=F)
[1] 0.1173571
GeneAnswers
Problem: Bioconductor 2.6 version doesn't work with yeast. After upgrading R to 2.13 and GeneAnswers to bioconductor 2.8 Error message while loading library: libcdt-4.dll not found.
Solution: Install Graphviz, then add the location of the libcdt-4.dll to your windows path. For Windows XP, My Computer -> Properties -> Advanced -> Environmental Variables button -> Edit. Append a semicolon and the directory with the dll (on my system: C:\Program Files\Graphviz2.20\bin).
